Ivan Rubbi 1†, Roberto Lupo 2†, Ritiana Marinelli 3, Federico Cucci 4*, Stefano Botti 5, Carmela
Triglia 6, Antonino Calabrò 7, Luana Conte 8,9‡, Elsa Vitale 10‡
- Department of Medical and Surgical Sciences, School of Nursing, University of Bologna, 40126 Bologna, Italy.
- Department of Surgery, ‘San Giuseppe da Copertino’ Hospital, Local Health Authority (ASL) of Lecce, 73100 Lecce, Italy.
- RSA “Oasi – Centro per la Terza Età”, Residential Socio‑Healthcare Facility, Via della Resistenza 105, 70013 Castellana Grotte, Bari, Italy.
- Città di Lecce Hospital, GVM Care & Research, 73100 Lecce, Italy.
- Hematology Unit, IRCCS Reggio Emilia Local Health Authority (Azienda USL), 42122 Reggio Emilia, Italy.
- Rizzoli Orthopedic Institute, Hospital of Argenta, Ferrara Local Health Authority, 44100 Ferrara, Italy.
- Department of Mental Health, Community Mental Health Center (CSM) of Biella, ASL BI, 13900 Biella, Italy.
- Laboratory of Advanced Data Analysis for Medicine (ADAM) at DReAM, University of Salento and Local Health Authority, “V. Fazzi” Hospital, 73100 Lecce, Italy.
- Department of Physics and Chemistry, University of Palermo, 90128 Palermo, Italy.
- Directorate of Health and Nursing Professions, Local Health Authority of Bari, 70100 Bari, Italy.
* Corresponding author: Federico Cucci, Città di Lecce Hospital, GVM Care & Research, 73100 Lecce, Italy. E-mail: fcucci@gvmnet.it
† These authors contributed equally to this work as first author.
‡ These authors contributed equally to this work as last author.
Cite this article
ABSTRACT
Background: Patients undergoing dialysis often experience reduced health-related quality of life, poor sleep quality, and increased perceived stress. These dimensions are closely interconnected and represent key aspects of holistic patient care. From a nursing perspective, their assessment is essential to support patient-centered interventions and improve clinical outcomes.
Aim: To evaluate health-related quality of life, sleep quality, and perceived stress in patients undergoing dialysis, and to explore differences across sociodemographic and clinical subgroups.
Methods: A cross-sectional study was conducted among adult patients aged 18 years or older undergoing dialysis. Data were collected using validated instruments, including the Short Form-36 Health Survey developed within the International Quality of Life Assessment Project, the Pittsburgh Sleep Quality Index, and the Perceived Stress Scale 10-item version. Descriptive statistics were computed, and inferential statistical analyses were performed to explore differences between groups and associations between variables. Comparisons between categorical variables were conducted using chi-square tests, while differences in continuous variables between groups were assessed using independent samples t-tests and analysis of variance. Correlations between variables were evaluated using Pearson correlation coefficients.
Results: A total of 148 patients were included. Overall, participants reported reduced quality of life, poor sleep quality, and moderate to high levels of perceived stress. Significant differences emerged across sociodemographic and clinical subgroups, particularly in relation to geographical area and selected clinical characteristics. Significant associations were also observed between quality-of-life domains, sleep quality, and perceived stress.
Conclusions: Patients undergoing dialysis experience multiple interrelated challenges affecting their well-being. From a nursing perspective, the systematic assessment of quality of life, sleep quality, and perceived stress represents a key component of comprehensive care. These findings support the role of nurses in identifying patient needs, guiding personalized care planning, and implementing targeted interventions aimed at improving overall patient outcomes.
Keywords: chronic kidney disease, dialysis, health-related quality of life, sleep quality, perceived stress, nursing.
INTRODUCTION
Chronic kidney disease (CKD) is defined by a persistent reduction in renal function, typically identified by a glomerular filtration rate below 60 mL/min/1.73 m² [1]. Affecting approximately 10% of the global population [2], CKD represents a major public health concern. The progressive increase in patients requiring renal replacement therapies, including dialysis, reflects an epidemiological context characterized by population aging and a high prevalence of cardiovascular and metabolic comorbidities [3]. Beyond its clinical burden, CKD profoundly influences daily functioning, psychosocial well-being, and healthcare organization.
Dialysis, although life-sustaining, imposes a complex and enduring impact on patients’ lives. Frequent treatment sessions, dietary and fluid restrictions, physical symptoms, and technological dependence significantly reshape daily routines and limit participation in work, social, and family roles. Health-related quality of life (QoL) in this context emerges as a multidimensional construct resulting from the interaction between physical health (Physical Component Summary, PCS), psychological-emotional status (Mental Component Summary, MCS), degree of autonomy, social relationships, and treatment-related constraints.
Psychological distress is increasingly recognized in individuals undergoing dialysis. Anxiety, depressive symptoms, and perceived stress are common and often underdiagnosed, despite their association with poorer treatment adherence, reduced quality of life, and adverse clinical outcomes [4]. Similarly, sleep disturbances—including insomnia, sleep apnea, restless legs syndrome, and excessive daytime sleepiness—are highly prevalent and have been linked to increased mortality risk, impaired daily functioning, and diminished well-being [5–8]. These dimensions frequently coexist and may interact, amplifying the subjective burden of chronic kidney failure. Within the Italian healthcare system, which is predominantly public and regionally organized, dialysis services are delivered across heterogeneous clinical contexts, including hospital-based units and home-based programs. Variability in service organization, availability of psychosocial support, and access to home dialysis modalities may influence patients lived experiences. While previous Italian studies have explored specific aspects such as depressive symptoms, stress, or the impact of educational interventions [9–13], recent nationwide data simultaneously examining health-related quality of life, sleep quality, and perceived stress in a heterogeneous dialysis population remain limited. Addressing these dimensions together may provide a more comprehensive understanding of the psychosocial burden associated with dialysis treatment and support the development of multidisciplinary care strategies tailored to the Italian context.
From a nursing perspective, the assessment of health-related quality of life, sleep quality, and perceived stress represents a fundamental component of holistic care in patients undergoing dialysis. Nurses play a central role in the continuous monitoring of these dimensions, as they are directly involved in patient education, symptom management, and the identification of psychosocial needs [14]. A comprehensive understanding of these aspects is essential to support individualized care planning and to improve patient outcomes in this population.
Primary objective
The primary objective of this study was to evaluate health-related quality of life, sleep quality, and perceived stress in patients undergoing dialysis.
Secondary objectives
The secondary objectives were to explore differences in these outcomes across sociodemographic and clinical subgroups and to examine the associations between quality of life, sleep quality, and perceived stress.
MATERIALS AND METHODS
Study design
This was a descriptive cross-sectional study with exploratory analytical components, conducted between January and October 2025 using an anonymous electronic questionnaire.
Questionnaire tools
Data were collected using a structured, self-administered questionnaire consisting of five sections.
- Sociodemographic variables
The first section included direct sociodemographic variables: sex, age (recorded in years and categorized into predefined age groups), marital status, educational level (highest qualification attained), and employment status.
Clinical characteristics included the presence of comorbidities and dialysis-related variables, such as the duration of dialysis treatment. Additional clinical information relevant to patients’ health status, including conditions associated with chronic kidney disease and treatment-related aspects, was also considered. Where available, information related to symptoms commonly reported by patients undergoing dialysis and potential behavioral adaptations to chronic illness was considered.
These variables were collected to characterize the sample and to allow subsequent stratified analyses (Table 1).
- Clinical characteristics, risk factors and lifestyle
The second section comprised structured items addressing:
- main known medical condition before dialysis initiation (single-response item);
- prior awareness of dialysis (defined as patients’ prior awareness or familiarity with dialysis treatment before its initiation, derived from information received through healthcare professionals, previous clinical experiences, or informal sources);
- symptoms and signs before diagnosis (multiple-response item);
- pre-diagnosis lifestyle habits (smoking, alcohol use, illicit drug use, salt intake, weight loss);
- behavioral changes and symptoms during or after dialysis initiation (multiple-response items).
For symptom-related questions, multiple answers were allowed; therefore, percentages may exceed 100% (Tables 2 and 3).
Pre-existing medical conditions were recorded as the main perceived disease rather than as a full multimorbidity profile.
- Health-related quality of life (SF-36)
Health-related quality of life was assessed using the official Italian version of the Short Form-36 Health Survey (SF-36) (IQOLA project)[15].
The instrument consists of 36 items grouped into eight domains:
- Physical Functioning (PF) – 10 items
- Role Limitations due to Physical Health (Role Physical, RP) – 4 items
- Role Limitations due to Emotional Problems (Role Emotional, RE) – 3 items
- Vitality (VT) – 4 items
- Mental Health (MH) – 5 items
- Social Functioning (SF) – 2 items
- Bodily Pain (BP) – 2 items
- General Health (GH) – 5 items
Scores are transformed to a 0–100 scale, with higher scores indicating better perceived health status. Physical and Mental Component Summary measures (PCS and MCS) were also derived[16].
- Sleep quality (PSQI)
Sleep quality was assessed using the Pittsburgh Sleep Quality Index (PSQI), developed by Buysse et al. The PSQI is a validated multidimensional instrument composed of 19 self-rated items generating seven components: subjective sleep quality, sleep latency, sleep duration, habitual sleep efficiency, sleep disturbances, use of sleeping medication, and daytime dysfunction.
The global score ranges from 0 to 21, with higher scores indicating poorer sleep quality. For analytical purposes, scores were categorized into three classes: good sleep quality (0–5), moderate impairment (6–10), and severe impairment (>10) [17].
- Perceived stress (PSS-10)
Perceived stress was measured using the 10-item version of the Perceived Stress Scale (PSS-10), developed by Cohen et al. This instrument evaluates the degree to which individuals perceive their life situations as stressful.
Items are rated on a five-point Likert scale (0 = never to 4 = very often), with four positively worded items reverse scored. Total scores range from 0 to 40, with higher scores indicating greater perceived stress. Scores were categorized as low (0–13), moderate (14–26), and high (27–40)[18].
Setting
Data were collected through an anonymous electronic questionnaire (Microsoft Forms) administered exclusively online between January and October 2025. The survey link was disseminated via major social networks (Facebook®, Instagram®, Reddit®) and through Italian provincial dialysis associations and patient support groups, allowing nationwide dissemination across Northern, Central, and Southern Italy and the Islands.
Participants completed the questionnaire independently using personal devices (smartphones, tablets, or computers), ensuring anonymity and voluntary participation.
Although data collection occurred in a virtual environment, respondents were individuals receiving dialysis treatment within established clinical settings in Italy, including hospital-based dialysis units, nephrology departments within the Italian National Health System, accredited private dialysis centers, and structured home-based dialysis programs (peritoneal dialysis and home hemodialysis). Therefore, the research setting was digital, whereas the clinical context of reference consisted of organized dialysis services within the Italian healthcare system.
The associations involved in disseminating the survey included regional branches of ANED and other Italian dialysis and transplant patient networks.
Participants
A non-probability convenience sampling strategy was adopted. Participants were recruited on a voluntary basis through online dissemination of the survey link via social networks (Facebook®, Instagram®, Reddit®) and provincial dialysis associations and patient support groups.
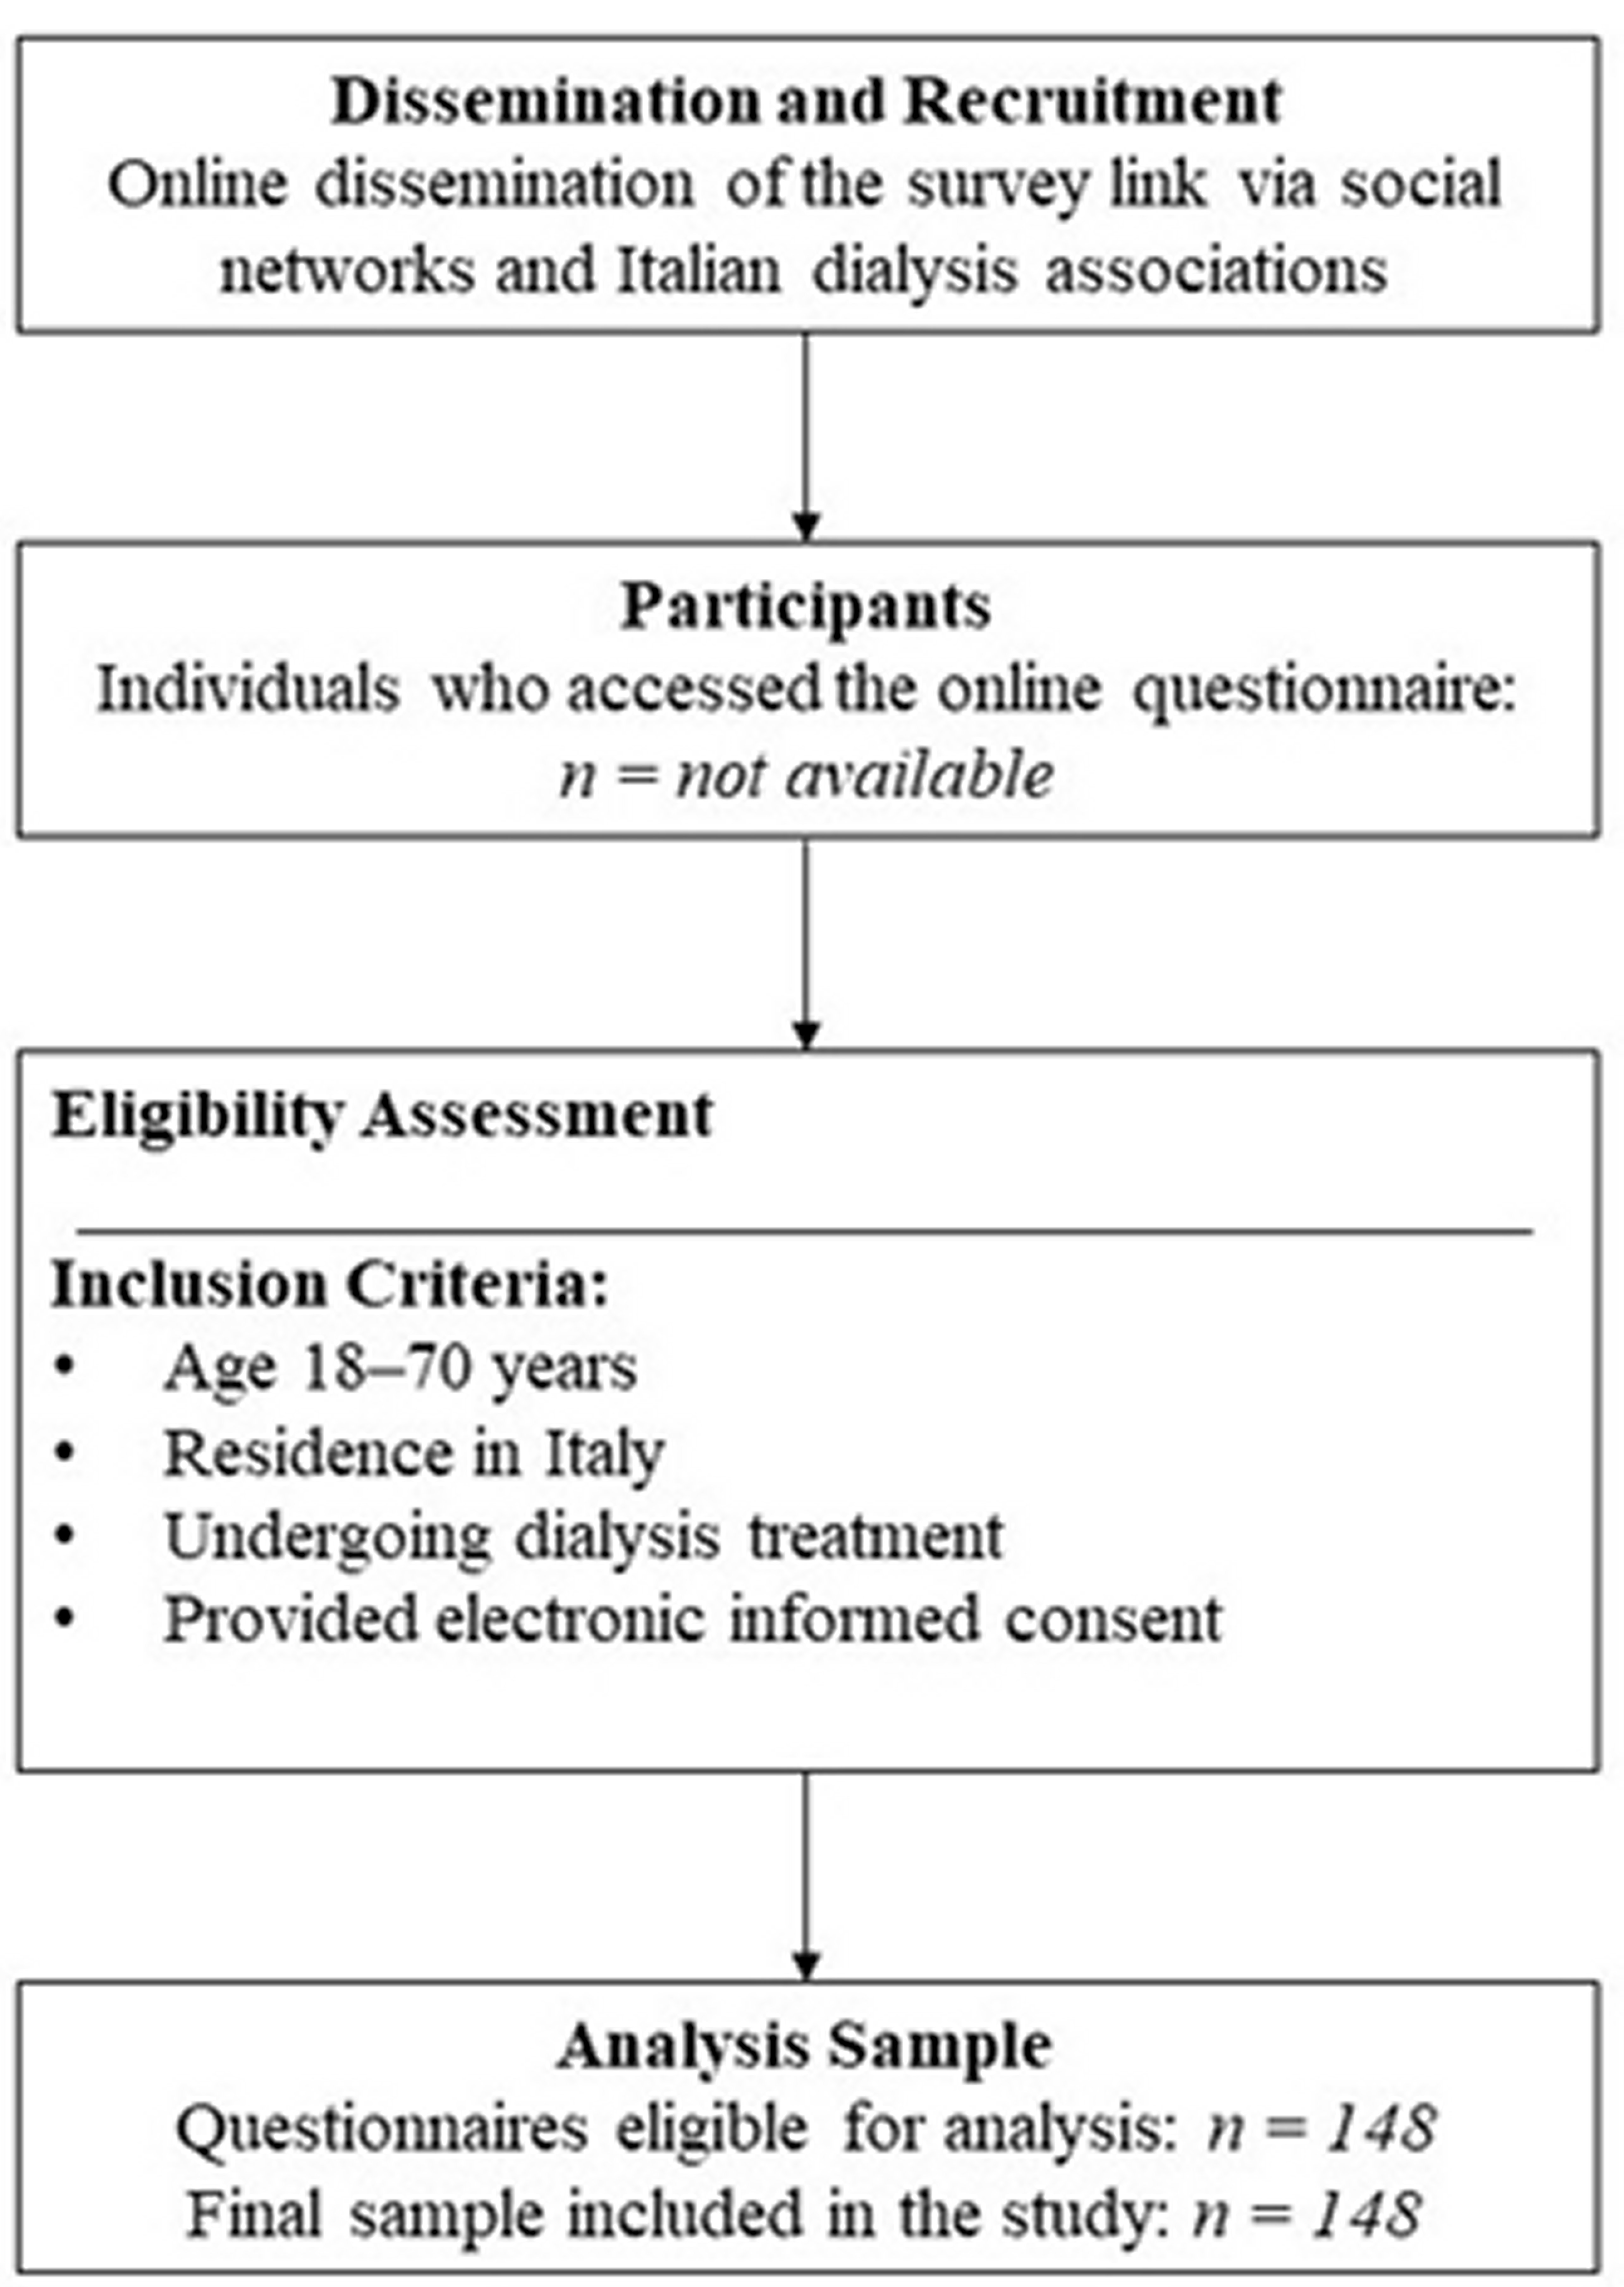
No formal a priori sample size calculation was performed. Given the exploratory and cross-sectional nature of the study, the aim was to obtain a nationwide snapshot of adults undergoing dialysis treatment in Italy rather than to test predefined hypotheses or estimate population parameters with predetermined statistical power. Eligible participants were adults aged 18 years or older, undergoing dialysis treatment and residing in Italy. Inclusion criteria were current dialysis treatment, residence in Italy, ability to understand the study information, and provision of electronic informed consent. Exclusion criteria were age below 18 years, failure to provide informed consent, and incomplete questionnaire completion. Participation was voluntary and unpaid. Participant recruitment, eligibility assessment, and inclusion in the final sample are summarized in a flow diagram (Figure 1).
Figure 1. Flow diagram of participant recruitment and inclusion.
Due to the open-access nature of the online survey and the anonymous recruitment process, it was not possible to determine the exact number of individuals who accessed the questionnaire or were excluded prior to completion.
The figure illustrates the online dissemination of the questionnaire, the eligibility assessment based on predefined inclusion criteria, and the final sample included in the analysis.
Statistical analysis
The dataset was created using Microsoft Excel (Microsoft Office®) and subsequently imported into Jamovi software (version 2.3.18) for statistical analysis. Descriptive statistics were performed. Continuous variables were expressed as mean ± standard deviation (SD), whereas categorical variables were reported as absolute frequencies and percentages. The internal consistency of the psychometric instruments (SF-36, PSQI, and PSS-10) was assessed using Cronbach’s alpha coefficient to evaluate their reliability within the study sample. The normality of continuous variables was assessed using the Shapiro–Wilk test and by visual inspection of histograms and Q–Q plots. Based on these assessments, parametric tests (independent samples t-test, one-way ANOVA, and Pearson’s correlation) were applied when normality assumptions were considered acceptable. Independent samples t-tests were used to compare mean SF-36 domain scores between two groups (e.g., sex, geographical area North/Central vs South/Islands, dialysis modality, number of weekly sessions). One-way analysis of variance (ANOVA) was applied to compare mean SF-36 domain scores across variables with more than two categories, specifically age groups and symptom categories reported during or after dialysis treatment. Chi-square (χ²) tests were used to examine associations between categorical variables, including PSQI and PSS-10 categories across sociodemographic and clinical groups. Correlations between continuous variables (PSQI total score, PSS-10 total score, and SF-36 domain scores) were analyzed using Pearson’s correlation coefficient (r). For analytical purposes, the geographical variable was dichotomized into two macro-areas (North/Central vs South/Islands). This grouping was adopted to ensure adequate sample size within each category and to improve the statistical stability of comparisons, given the relatively small sample size and the uneven distribution of participants across regions. All tests were two-tailed, and statistical significance was set at p-value < 0.05.
RISULTS
Sample characteristics
Although some deviations from normality were observed, parametric tests were considered appropriate given the sample size and the robustness of these methods.
Sociodemographic and clinical characteristics of our sample were reported in Table 1.
Socio-demographic characteristics n (%) Geographical area North
Central
South and Islands
51(34.5)
17(11.5)
80(54.1)
Gender Female
Male
75(50.7)
73(49.3)
Age 21-30 years
31-40 years
41-50 years
51-60 years
61-70 years
Over 71 years
11(7.4)
21(14.2)
36(24.3)
45(30.4)
23(15.5)
12(8.1)
Civil status Married
Unmarried
Divorced/Separated
84(56.8)
41(27.7)
23(15.5)
Educational level No qualifications
Middle school diploma
High school diploma
Bachelor’s degree
Postgraduate education
4(2.7)
33(22.3)
64(43.2)
36(24.3)
11(7.4)
Work employment Housewife/househusband
Public employee
Freelancer
Factory worker
Retired
Student
Other occupation
16(10.8)
17(11.5)
16(10.8)
20(13.5)
41(27.7)
6(4.1)
32(21.6)
How old were you when you started dialysis? 43.9±14.7 Actually you: await a kidney transplant
already undergo a kidney transplant
undergo Automated Peritoneal Dialysis (APD)
undergo Continuous Ambulatory Peritoneal Dialysis (CAPD)
undergo home hemodialysis
undergo assisted home hemodialysis
undergo in-center hemodialysis
5(3.4)
6(4.0)
18(12.1)
10(6.8)
5(3.4)
4(2.7)
100(67.6)
Presence of symptoms/signs during or after dialysis Yes
No
81(54.7)
67(45.3)
How often do you undergo dialysis treatment? Every day
5 times/week
4 times/week
3 times/week
2 times/week
1 time/week
22(14.9)
4(2.7)
11(7.4)
92(62.2)
11(7.4)
8(5.4)
Table 1. Sociodemographic and clinical characteristics of the sample (n = 148)
A total of 148 participants were included in the analysis; of these, 50.7% were female (n=75). The most represented age group was 51–60 years, accounting for 30.4% of the sample and 45 participants, followed by 41–50 years with 24.3% and 36 participants, and 61–70 years with 15.5% and 23 participants. Most respondents were married, representing 56.8% and 84 individuals, whereas 27.7%, corresponding to 41 participants, were unmarried and 15.5%, corresponding to 23 participants, were divorced or separated.
Regarding educational level, the largest proportion of participants completed lower secondary school, accounting for 43.2% and 64 individuals, followed by upper secondary school with 24.3% and 36 individuals. A minority held a postgraduate degree, representing 7.4% and 11 participants. Retirement was the most common occupational status, accounting for 27.7% and 41 individuals, followed by factory work with 13.5% and 20 individuals, other occupations with 21.6% and 32 individuals, public employment with 11.5% and 17 individuals, and self-employment with 10.8% and 16 individuals. Only 4.1% of the sample, corresponding to 6 participants, were students.
The mean age at dialysis initiation was 43.9 years with a standard deviation of 14.7 years. At the time of survey completion, 67.6% of participants, corresponding to 100 individuals, were receiving in-centre hemodialysis.
The remaining participants were distributed across automated peritoneal dialysis, accounting for 12.1% and 18 individuals; continuous ambulatory peritoneal dialysis, 6.8% and 10 individuals; home hemodialysis, 3.4% and 5 individuals; and assisted home hemodialysis, 2.7% and 4 individuals. A small proportion reported being on the transplant waiting list, representing 3.4% and 5 individuals, while 4.0% and 6 individuals had already undergone kidney transplantation.
Most patients reported three dialysis sessions per week, accounting for 62.2% and 92 individuals. Smaller proportions underwent four sessions per week, representing 7.4% and 11 individuals; five sessions per week, 2.7% and 4 individuals; daily dialysis, 14.9% and 22 individuals; or lower frequencies of one to two sessions per week, representing 12.8% and 19 individuals.
Overall, 54.7% of the sample, corresponding to 81 participants, reported at least one symptom or sign during or after the dialysis session.
Medical history and lifestyle before dialysis initiation
More than half of the sample, representing 54.0% and corresponding to 80 participants, reported a known diagnosis of kidney failure before starting dialysis (Table 2). Hypertension was indicated as the main pre-existing medical condition by 18.9% of participants, corresponding to 28 individuals. Smaller proportions reported diabetes mellitus, accounting for 6.8% and 10 individuals, or no other medical condition, representing 11.5% and 17 individuals, indicating the absence of comorbidities beyond chronic kidney disease. Most participants, corresponding to 68.2% and 101 individuals, stated that they had heard about dialysis before initiating treatment, suggesting a certain degree of prior awareness of the therapeutic pathway. The most frequently reported symptoms before diagnosis were marked fatigue, accounting for 23.6% and 35 individuals, and swelling of the feet and ankles, reported by 22.9% and 34 individuals. Other symptoms, including nausea, vomiting, reduced urine output, itching, diffuse cramp-like pain, insomnia, or psychological complaints, were reported less frequently. A non-negligible proportion of participants reported no specific symptoms or only vague complaints.
Regarding lifestyle behaviors, 37.8% of participants, corresponding to 56 individuals, had smoked before diagnosis; 28.4%, corresponding to 42 individuals, reported alcohol consumption; and 12.2%, corresponding to 18 individuals, reported illicit drug use. Most participants did not experience marked weight loss prior to dialysis, accounting for 72.3% and 107 individuals, and 70.3%, corresponding to 104 individuals, did not habitually consume high-salt foods. Nevertheless, 85.1% of the sample, corresponding to 126 participants, stated that they had never received structured dietary counselling after diagnosis.
n (%) Main known medical condition before starting dialysis: Diabetes mellitus
Kidney failure
High blood pressure
No other medical condition
Other medical conditions
10(6.8)
80(54.0)
28(18.9)
17(11.5)
13(8.8)
Before dialysis, had you ever heard of dialysis? Yes
No
101(68.2)
47(31.8)
What were symptoms and signs before the diagnosis?
FatigueSwelling in feet and anklesAnxietyHeart palpitationsRenal colicMental confusionInvoluntary muscle contractionsRoutine checkups because my father had polycystic kidney disease
Depression
Diarrhea
Diffuse cramp-like pain
Postpartum hemorrhage
I was young when I found out. I suffered from urinary tract infections
Urinalysis
Bladder inflammation
Pregnancy
Insomnia
Red spots on lower limbs
Congenital disease
Loss of appetite
Nausea and vomiting
No symptoms
None
Vision problems
Heart problems
Protein in urine
Itching
Reduced urine output
Cyst rupture and severe bleeding, causing skyrocketing values
I have been suffering from CRF for a year, I already knew
Missing
35(23.6)
34(22.9)
1(0.7)
1(0.7)
1(0.7)
1(0.7)
4(2.7)
1(0.7)
1(0.7)
1(0.7)
3(2.0)
1(0.7)
1(0.7)
1(0.7)
1(0.7)
1(0.7)
5(3.4)
1(0.7)
1(0.7)
5(3.4)
19(12.8)
2(1.4)
3(2.0)
1(0.7)
1(0.7)
1(0.7)
1(0.7)
13(8.8)
1(0.7)
3(2.0)
3(2.0)
Had you ever smoked before your diagnosis? Yes
No
56(37.8)
92(62.2)
Had you ever consumed alcohol prior to your diagnosis? Yes
No
42(28.4)
106(71.6)
Had you used drugs before your diagnosis? Yes
No
18(12.2)
130(87.8)
Had you lost weight before undergoing dialysis? Yes
No
41(27.7)
107(72.3)
Did you consume foods high in salt before the onset of the disease? Yes
No
44(29.7)
104(70.3)
After your diagnosis, did you ever receive any dietary advice for your health problem? They told me to eat less salt, no bouillon cubes, canned
Foods, or cured meats
Nephrologist, and then I went to a nutritionist
No
Yes
1(0.7)
1(0.7)
7(4.7)
13(8.8)
126(85.1)
Table 2. Medical history and lifestyle before dialysis initiation.
Note to Table 2
Participants could report more than one symptom/sign; therefore, the total number of responses exceeds the sample size and percentages do not sum to 100%. Participants were asked to report the main known medical condition before the onset of chronic kidney disease (single-response item); therefore, these data do not capture the full burden of multimorbidity. The modality: “No other medical condition” indicates the absence of comorbidities other than chronic kidney disease.
Lifestyle, symptoms, and perceived health after dialysis initiation
Following diagnosis and dialysis initiation, clear changes in health-risk behaviors were observed (Table 3). A total of 81.8% of participants, corresponding to 121 individuals, reported no longer smoking; 87.8%, corresponding to 130 individuals, no longer consumed alcohol; and 90.5%, corresponding to 134 individuals, no longer used illicit drugs, suggesting a shift towards healthier lifestyles. With respect to body weight, 59.5% of the sample, corresponding to 88 participants, reported weight loss since starting dialysis, in many cases exceeding 6 kilograms and, for a relevant minority, more than 20 kilograms. Most participants, representing 83.8% and 124 individuals, stated that they no longer consumed high-salt foods, in line with nutritional recommendations for chronic kidney disease. During or after dialysis sessions, 54.7% of participants, corresponding to 81 individuals, experienced at least one treatment-related symptom. The most frequently reported complaints were swelling of the feet and ankles, accounting for 12.8% and 19 individuals; hypotension or blood pressure drop, 7.4% and 11 individuals; reduced urine output, 6.0% and 9 individuals; and headache, 6.8% and 10 individuals.
n (%) Did you continue smoking after your diagnosis? Yes
No
27(18.2)
121(81.8)
Did you continue to drink alcohol after your diagnosis? Yes
No
18(12.2)
130(87.8)
Did you continue to take drugs after your diagnosis? Yes
No
14(9.5)
134(90.5)
Indicate weight loss since diagnosis (for those who answered NO to the previous question, select the answer NONE)
None
0-5 kg
6-10 kg
11-20 kg
Over 21 kg
60(40.5)
18(12.2)
48(32.4)
8(5.4)
14(9.5)
Have you lost weight since starting dialysis? Yes
No
88(59.5)
60(40.5)
After your diagnosis, did you continue to eat foods high in salt? Yes
No
24(16.2)
124(83.8)
What symptoms and signs did you experience during or after dialysis treatment? Swelling in feet and ankles
Anxiety
Asthenia
Drop in blood pressure
Mental confusion
Involuntary muscle contractions
Diffuse cramp-like pain
Insomnia
Hypotension
Hypotension, fatigue
Low back pain
But in the head
Loss of appetite
Nausea and vomiting
None
Low blood pressure
Reduced urine output
Restless legs syndrome
Constipation
Fatigue and weakness
No symptoms
19(12.8)
1(0.7)
1(0.7)
5(3.4)
3(2.0)
2(1.4)
2(1.4)
1(0.7)
1(0.7)
1(0.7)
1(0.7)
10(6.8)
7(4.7)
1(0.7)
2(1.4)
11(7.4)
9(6.0)
1(0.7)
2(1.4)
1(0.7)
67(45.2)
Perceived health status Very good
Good
Bad
Very bad
17(11.5)
71(47.9)
50(33.8)
10(6.8)
Table 3. Lifestyle, symptoms, and perceived health status after dialysis initiation.
Other symptoms, including asthenia, diffuse cramps, gastrointestinal disturbances, restless legs syndrome, sleep problems, or psychological symptoms, were reported less frequently. Despite this symptom burden, 58.9% of participants, corresponding to 86 individuals, rated their health status as very good or good, whereas 41.0%, corresponding to 60 individuals, perceived their health as bad or very bad.
Psychometric properties of the instruments and score distribution
Table 4 summarizes the internal consistency of the study instruments in the present sample and the distribution of their scores, reported to document measurement reliability and to describe the clinical profile of the study population.
Scale n % Cronbach’s alpha (a) PSQI (Pittsburgh Sleep Quality Index) 0.724 Good sleep quality — — Moderately impaired sleep quality 76 51.4 Severely impaired sleep quality 72 48.6 PSS-10 (10-item Perceived Stress Scale) 0.728 Low 15 10.1 Moderate 106 71.6 High 27 18.2 SF-36 (Short Form-36 Health Survey) M SD Cronbach’s alpha (a) Physical Functioning (PF) 48.8 29.0 0.911 Role limitations due to physical health, (RP) 30.6 38.0 0.845 Role limitations due to emotional problems (RE) 36.5 41.4 0.822 Vitality (VT) 42.3 20.5 0.684 Mental Health (MH) 49.8 22.0 0.766 Social Functioning (SF) 52.4 23.0 0.716 Bodily Pain (BP) 62.1 25.2 0.878 General Health (GH) 33.5 20.5 0.648 Total 44.1 19.5 0.932 Table 4. Psychometric properties and score distribution of the instruments (PSQI, PSS-10, SF-36).
The Pittsburgh Sleep Quality Index demonstrated good internal consistency, with Cronbach’s alpha coefficient of 0.724. According to the predefined cut-offs, none of the participants fell within the good sleep quality category. Moderate sleep impairment was observed in 51.4% of the sample, corresponding to 76 individuals, while 48.6%, corresponding to 72 individuals, presented severe impairment. These findings indicate that clinically relevant sleep disturbances were highly prevalent within the sample.
The Perceived Stress Scale 10-item version showed satisfactory internal consistency, with a Cronbach’s alpha of 0.728. Low stress levels were reported by 10.1% of participants, corresponding to 15 individuals. The majority of the sample presented moderate stress, accounting for 71.6% and 106 individuals, whereas 18.2%, corresponding to 27 individuals, reported high perceived stress.
Regarding the SF-36, internal consistency coefficients across domains ranged from 0.648 for General Health to 0.911 for Physical Functioning, indicating overall acceptable to excellent reliability. The total SF-36 score showed excellent internal consistency, with a Cronbach’s alpha of 0.932.
The mean overall SF-36 score was 44.1 with a standard deviation of 19.5, suggesting a moderate level of health-related quality of life. Domain-level analysis revealed the lowest scores in Role Physical, with a mean of 30.6 and a standard deviation of 38.0, Role Emotional, with a mean of 36.5 and a standard deviation of 41.4, and General Health, with a mean of 33.5 and a standard deviation of 20.5. These findings indicate substantial limitations in both physical and emotional role functioning and in overall health perception. Conversely, Bodily Pain showed relatively higher scores, with a mean of 62.1 and a standard deviation of 25.2, and Social Functioning a mean of 52.4 with a standard deviation of 23.0, suggesting comparatively better preservation of these domains. Vitality and Mental Health displayed intermediate values, with means of 42.3 and 49.8, respectively, indicating moderate impairment in energy levels andmental health.
Health-related quality of life, sleep quality, and perceived stress across sociodemographic and clinical subgroups
Differences in SF-36 domain scores across sociodemographic and clinical variables are presented in Table 5.
SF – 36 (Mean±SD) PF RP RE VT MH SF BP GH Geographic area North and Central 54.4±31.3 39.0±40.4 44.6±41.0 42.6±21.4 50.8±24.0 54.6±23.4 63.5±24.5 36.2±20.8 South and Islands 44.1±26.2 23.4±34.5 29.6±40.7 42.1±19.9 48.9±20.3 50.6±22.8 61.0±25.9 31.3±20.2 p-value
t = 2.19; p = <0.03* t = 2.52; p = 0.01*
t = 2.23; p = 0.02* t = 0.13; p = 0.89 t = 0.51; p = 0.61 t = 1.04; p = 0.29 t = 0.60; p = 0.54 t = 1.44; p = 0.15 Age group 21-30 35.0±31.7 22.7±32.5 18.2±31.1 42.7±24.4 38.9±27.0 36.4±23.4 59.5±33.1 34.1±22.1 31-40 62.1±30.2 45.2±41.5 57.1±38.2 48.3±16.1 57.5±17.0 57.7±20.3 69.3±22.3 39.1±15.6 41-50 51.4±29.6 25.0±29.9 35.2±39.0 36.7±22.5 45.7±24.1 51.0±22.6 60.3±24.3 31.9±19.7 51-60 47.9±24.9 26.7±38.2 36.3±44.3 43.4±19.7 49.0±19.8 51.1±24.4 55.3±25.6 29.7±21.0 61-70 43.7±30.1 35.0±43.4 31.4±42.0 43.0±20.2 53.7±22.4 57.5±21.5 69.3±23.1 37.0±22.5 p-value
F = 2.15; p = 0.07 F = 1.34; p = 0.25
F = 2.04; p = 0.09 F = 1.19; p = 0.32 F = 1.98; p = 0.10 F = 2.18; p = 0.07 F = 2.08; p = 0.08 F = 1.26; p = 0.29 Gender Female 55.5±28.3 30.3±36.8 35.1±39.9 41.3±21.7 49.3±23.1 51.3±23.5 60.7±24.7 31.7±20.4 Male 42.0±28.3 30.8±39.4 37.9±43.1 43.4±19.2 50.2±21.1 53.6±22.7 63.6±25.9 35.5±20.7 p-value
t = 2.89; p = <0.01** t = -0.07; p = 0.93
t = -0.40; p = 0.68 t = -0.60; p = 0.52
t = -0.23; p = 0.81 t = -0.59; p = 0.55 t = -0.68; p = 0.49 t = -1.13; p = 0.26 Dialysis modality (‡) Peritoneal Dialysis 57.3±30.2 34.8±38.7 38.1±37.1 45.2±17.3 55.6±19.8 50.4±23.4 64.1±23.9 35.4±17.9 Hemodialysis 45.0±27.9 28.4±36.9 33.6±41.7 40.2±21.0 47.3±22.7 51.4±22.8 60.8±25.1 32.3±21.3 p-value
t = 2.04; p = <0.04* t = 0.80; p = 0.42 t = 0.51; p = 0.60 t = 1.14; p = 0.25 t = 1.76; p = 0.08 t = -0.19; p = 0.84 t = 0.62; p = 0.53 t = 0.69; p = 0.48 Dialysis sessions per week ≤3 sessions – week 47.6±28.4 31.1±38.3 37.5±43.4 41.5±21.0 48.1±22.6 53.7±22.3 63.4±23.9 34.3±21.0 3 sessions-week 52.6±30.8 29.1±37.5 33.3±35.1 44.9±19.1 54.6±19.6 48.6±25.1 58.4±29.0 31.4±19.3 p-value
t = -0.90; p = 0.36
t = 0.28; p = 0.78 t = 0.53; p = 0.59
t = -0.86; p = 0.38
t = -1.54; p = 0.12 t = 1.16; p = 0.24 t = 1.04; p = 0.29 t = 0.75; p = 0.45 Symptoms None 48.8±28.4 37.5±47.9 41.7±50.0 57.5±28.4 74.0±16.5 65.6±23.7 83.1±33.8 20.0±17.8 Gastrointestinal symptoms 46.8±29.3 33.8±37.4 40.0±39.9 51.8±16.7 50.2±20.3 55.6±23.1 62.1±27.9 42.8±19.8 Hypotension-hemodynamic instability 49.5±37.8 40.9±39.2 54.5±47.8 48.2±18.2 57.1±22.3 59.1±33.1 63.0±29.9 32.7±21.5 Musculoskeletal pain 52.5±37.2 28.1±41.1 37.5±45.2 54.4±17.4 58.5±18.0 56.3±25.0 59.4±20.0 35.0±21.9 Fatigue and weakness 47.4±26.8 23.4±34.7 29.4±40.0 35.5±20.5 44.1±22.0 48.5±21.2 58.6±23.5 28.8±19.7 Psychological 46.1±30.4 39.5±40.2 36.8±38.3 42.6±17.8 52.0±19.4 46.7±18.6 64.6±26.9 40.0±19.9 Other 65.0±28.7 50.0±48.6 60.0±43.9 52.5±17.4 63.2±22.1 71.3±21.3 77.3±21.1 44.0±19.3 p-value
F = 0.60; p = 0.72
F = 1.26; p = 0.27 F = 1.31; p = 0.25 F = 3.89; p <0.01**
F = 2.93; p = 0.01* F = 2.55; p = 0.04* F = 1.37; p = 0.22 F = 2.53; p = 0.02* Table 5. Differences in SF-36 domain scores across sociodemographic and clinical subgroups.
Note to Table 5
SF-36 = Short Form-36 Health Survey; PF = Physical functioning; RP = Role limitations due to physical health; BP = Bodily pain; GH = General health; VT = Vitality; SF = Social functioning; RE = Role limitations due to emotional problems; MH = Mental health;
Independent samples t-tests were used for dichotomous variables, whereas one-way ANOVA was applied to variables with more than two categories, namely age groups and symptom categories.
- Geographical area. Patients living in Northern and Central Italy displayed significantly higher mean scores than those from Southern Italy and the Islands for physical functioning, with a mean of 54.4 and a standard deviation of 31.3 compared with a mean of 44.1 and a standard deviation of 26.2, with a p-value lower than 0.03. Significant differences were also observed for role limitations due to physical health, with mean values of 39.0 and 23.4 and standard deviations of 40.4 and 34.5 respectively, with a p-value of 0.01, and for role limitations due to emotional problems, with mean values of 44.6 and 29.6 and standard deviations of 41.0 and 40.7 respectively, with a p-value of 0.02.
Sleep quality also differed significantly across geographical areas. Participants from Northern and Central regions more frequently showed moderate impairment and less frequently severe impairment compared with those from Southern and Island regions, with a p-value of 0.04, suggesting poorer sleep quality in the latter group. No statistically significant differences emerged for perceived stress levels.
- Age classes. No statistically significant differences in SF-36 domains, PSQI categories, or PSS-10 levels were observed across age groups, as all p-values were greater than 0.05. Nevertheless, some variation in mean scores was observed at a descriptive level.
- Women reported significantly better physical functioning than men, with a mean of 55.5 and a standard deviation of 28.3 compared with a mean of 42.0 and a standard deviation of 28.3, with a p-value lower than 0.01. No significant differences were observed for the remaining SF-36 domains. Sleep quality, however, was significantly worse among women, as the prevalence of severe sleep impairment was higher in females than in males, with a p-value lower than 0.01. Perceived stress levels did not differ significantly by gender.
- Dialysis modality. Patients undergoing peritoneal dialysis showed significantly higher physical functioning scores than those undergoing hemodialysis, with mean values of 57.3 and 45.0 and standard deviations of 30.2 and 27.9 respectively, with a p-value lower than 0.04. No statistically significant differences were observed for the other SF-36 domains, PSQI categories, or PSS-10 levels.
- Number of sessions per week. No significant differences were found in health-related quality of life, sleep quality, or perceived stress between patients undergoing three or fewer sessions per week and those undergoing more than three sessions per week, as all p-values were greater than 0.05.
- Presence and type of symptoms. The presence and type of symptoms during or after dialysis were significantly associated with several SF-36 domains. Significant associations were observed for vitality, with a p-value lower than 0.01; emotional well-being, with a p-value of 0.01; social functioning, with a p-value of 0.04; and general health, with a p-value of 0.02. Patients reporting fatigue and weakness, psychological symptoms, or more complex symptom clusters tended to show lower scores in these domains compared with asymptomatic patients or those reporting predominantly gastrointestinal symptoms.
The distribution of sleep quality (PSQI categories) and perceived stress (PSS-10 levels) across the same subgroups is reported in Table 6. Table 6 shows that sleep quality differed significantly according to geographical area, gender, and symptom burden. Participants living in Southern Italy and the Islands, women, and patients reporting fatigue, weakness, or psychological symptoms were more likely to experience severe sleep impairment. By contrast, perceived stress levels did not differ significantly across most sociodemographic and clinical subgroups, although patients with greater symptom burden tended to report higher stress levels. In particular, fatigue and weakness were more frequently associated with high perceived stress.
PSQI (Sleep quality) PSS-10 (Stress level) Moderately Severely Low Moderate High n (%) n (%) Geographical area North and Central Italy 41(53.9) 27(37.5) 11(73.3) 44(41.5) 13(48.1) South and Islands 35(46.1) 45(62.5) 4(26.7) 62(58.5) 14(51.9) c² = 4.03; p-value = 0.04* c² = 5.42; p-value = 0.66 Age group 21-30 3(3.9) 8(11.1) 1(6.7) 7(6.6) 3(11.1) 31-40 12(15.8) 9(12.5) 4(26.7) 12(11.3) 5(18.8) 41-50 21(27.6) 15(20.8) 3(20.0) 26(24.5) 7(25.9) 51-60 25(32.9) 20(27.8) 2(13.3) 34(32.1) 9(33.3) 61-70 15(19.7) 20(27.8) 5(33.3) 27(25.5) 3(11.1) c² = 4.87; p-value = 0.31 c² = 7.51; p-value = 0.48 Gender Female 28(36.8) 47(65.3) 8(53.3) 51(48.1) 16(59.3) Male 48(63.2) 25(34.7) 7(46.7) 55(51.9) 11(40.7) c² = 12.0; p-value = <0.01** c² = 1.12; p-value = 0.57 Dialysis modality (‡) Peritoneal Dialysis 14(19.7) 14(21.2) 5(35.7) 19(19.4) 4(16.0) Hemodialysis 57(80.3) 52(78.8) 9(64.3) 79(80.6) 21(84.0) c² = 0.04; p-value = 0.82 c² = 2.38; p-value = 0.30 Dialysis sessions per week ≤ 3 sessions – week 56(73.7) 55(76.4) 8(53.3) 83(78.3) 20(74.1) 3 sessions – week 20(26.3) 17(23.6) 7(46.7) 23(21.7) 7(25.9) c² = 0.14; p-value = 0.70 c² = 4.38; p-value = 0.11 Symptoms None 4(5.3) — 2(13.3) 1(0.9) 1(3.7) Gastrointestinal symptoms 12(15.8) 8(11.1) 2(13.3) 15(14.2) 3(11.1) Hypotension – hemodynamicinstability 8(10.5) 3(4.2) 2(13.3) 8(7.5) 1(3.7) Musculoskeletalpain 1(1.3) 7(9.7) — 8(7.5) — Fatigue and weakness 37(48.7) 39(54.2) 7(46.7) 50(47.2) 19(70.4) Psychological 7(9.2) 12(16.7) — 16(15.1) 3(11.1) Other 7(9.2) 3(4.2) 2(13.3) 8(7.5) — c² = 14.4; p-value = 0.02* c² = 19.7; p-value = 0.07 Table 6. Distribution of sleep quality (PSQI) and perceived stress (PSS-10) across sociodemographic and clinical subgroups.
PSQI categories also differed significantly across symptom groups, with a p-value of 0.02, indicating that more symptomatic patients were more likely to experience severe sleep impairment.
The distribution of PSS-10 levels showed a near-significant trend, with a p-value of 0.07, suggesting a possible association between symptom burden and perceived stress.
Correlations between sleep quality, perceived stress, and quality of life
Table 7 presents the correlations between sleep quality measured through the Pittsburgh Sleep Quality Index, perceived stress assessed by the Perceived Stress Scale 10-item version, and selected SF-36 domains. A positive correlation emerged between PSQI and PSS-10 scores, with r equal to 0.199 and a p-value lower than 0.05. This finding indicates that poorer sleep quality, reflected by higher PSQI scores, was associated with higher levels of perceived stress. PSQI scores showed significant negative correlations with several SF-36 domains. A negative association was observed with vitality, with r equal to −0.178 and a p-value lower than 0.05, with social functioning, with r equal to −0.273 and a p-value lower than 0.05, and with bodily pain, with r equal to −0.256 and a p-value lower than 0.05. Overall, worse sleep quality was associated with lower energy levels, reduced social functioning, and a greater impact of pain. Similarly, PSS-10 scores were negatively correlated with several domains of health-related quality of life. Significant associations were found with physical functioning, with r equal to −0.376 and a p-value lower than 0.01, with role limitations due to physical health, with r equal to −0.294 and a p-value lower than 0.01, with role limitations due to emotional problems, with r equal to −0.433 and a p-value lower than 0.01, and with emotional well-being, where one of the strongest correlations was detected, with r equal to −0.676 and a p-value lower than 0.01. Additional negative correlations were found with vitality, with r equal to −0.673 and a p-value lower than 0.01, with social functioning, with r equal to −0.480 and a p-value lower than 0.01, with bodily pain, with r equal to −0.377 and a p-value lower than 0.01, and with general health, with r equal to −0.545 and a p-value lower than 0.01. These findings indicate that higher perceived stress was associated with poorer overall health perception, greater pain-related interference, reduced social participation, and broader impairments across both physical and psychological domains. Taken together, these results highlight a strong interplay between sleep quality, perceived stress, and health-related quality of life.
PSQI PSS-10 r p-value r p-value PSQI — — 0.199* < 0.05 SF-36 = Short Form-36 Health Survey, SF-36 Physical Functioning (PF) -0.030 0.71 -0.376* < 0.01 SF-36 Role limitations due to physical health (RP) -0.090 0.27 -0.294* < 0.01 SF-36 Role limitations due to emotional problems (RE) -0.151 0.06 -0.433* < 0.01 SF-36 Vitality (VT) -0.178* < 0.05 -0.673* < 0.01 SF-36 Mental health (MH) -0.100 0.22 -0.676* < 0.01 SF-36 Social functioning (SF) -0.273* < 0.05 -0.480* < 0.01 SF-36 Bodily Pain (BP) -0.256* < 0.05 -0.377* < 0.01 SF-36 General Health (GH) -0.061 0.46 -0.545* < 0.01 * = significant test, r = Pearson correlation coefficient Table 7. Pearson correlation analysis between sleep quality (PSQI), perceived stress (PSS-10), and SF-36 domains.
DISCUSSION
Dialysis is a life-sustaining therapy, but it entails a substantial and long-lasting burden on the everyday lives of people with chronic kidney disease. The findings of this study confirm that the dialysis experience simultaneously involves physical, psychological and social dimensions, and that the clinical management of end-stage renal disease cannot be reduced to the control of laboratory parameters alone [9,19,20].
This multidimensional burden has been widely documented in previous studies, which describe dialysis as a condition affecting physical, psychological, and social domains simultaneously, with significant implications for patients’ daily functioning and well-being [21,22].
The absence of data on dialysis vintage and caregiving support may have limited the interpretation of some findings, as these factors are known to influence patients’ adaptation to treatment and perceived burden.
Given the cross-sectional design of the study, the findings should be interpreted as associations observed at a single time point rather than causal relationships.
In our sample, SF-36 scores depict an overall moderate level of health-related quality of life, with marked impairment of role limitations due to physical and emotional problems and of general health perception. This pattern is consistent with previous studies in dialysis populations, which have shown that difficulties concern not only somatic symptom burden, but also the ability to maintain work, family and social roles that are coherent with one’s pre-morbid identity [10–13]. From this perspective, health-related quality of life emerges as the dynamic outcome of a continuous renegotiation between disease, treatment and life projects.
These findings are consistent with previous research showing that patients undergoing dialysis report significantly lower SF-36 scores compared to the general population, particularly in domains related to physical and emotional roles [23,24].
One of the most critical findings of this study is the virtual absence of “good sleepers” according to PSQI criteria and the very high prevalence of moderate or severe sleep disturbance. This observation aligns with a robust body of literature showing that sleep problems are highly prevalent among hemodialysis patients and are associated with substantially poorer quality of life across multiple domains [21,25,26].
Indeed, sleep disturbances have been reported in up to 50–80% of patients undergoing hemodialysis and are consistently associated with poorer quality of life and increased symptom burden [25,27,28].
In our sample, higher PSQI scores (worse sleep) were associated with lower scores in selected SF-36 domains, particularly vitality, social functioning and bodily pain. The association with vitality is particularly relevant, as it suggests that poor sleep may be closely linked to reduced energy levels and fatigue, which can substantially affect daily functioning and coping capacity [28].
This pattern echoes previous studies reporting significantly worse SF-36 profiles in “poor sleepers” than in “good sleepers”, and a negative correlation between global PSQI scores and overall health-related quality of life [21,25].
Clinically, sleep should therefore not be considered a secondary epiphenomenon of chronic kidney disease, but rather a relevant modulator of the dialysis experience: non-restorative sleep may reduce the cognitive and emotional resources required to cope with treatment demands, amplify fatigue, increase pain interference, and compromise the patient’s ability to sustain social participation [27,28].
This interpretation is supported by previous studies suggesting that poor sleep quality is an independent predictor of reduced quality of life and adverse clinical outcomes in dialysis populations [27]. Perceived stress, as measured by the PSS-10, showed significant associations with multiple domains of the SF-36, including physical functioning, role limitations due to physical and emotional problems, vitality, mental health, social functioning, bodily pain and general health. This is consistent with studies in hemodialysis populations reporting that higher stress levels are related to poorer quality of life and, in some cases, reduced resilience [29].
Previous evidence indicates that chronic stress in dialysis patients is associated with treatment burden, uncertainty, and reduced coping capacity, contributing to poorer psychosocial outcomes [30].
In our sample, this pattern suggests that stress may affect not only emotional adjustment but also the patient’s ability to maintain physical roles and daily functioning [29].
The most salient aspect, however, is the positive correlation between PSS-10 and PSQI scores, suggesting a bidirectional relationship between stress and sleep quality.
This bidirectional association has been previously described in the literature, where sleep disturbances and psychological distress mutually reinforce each other, creating a cycle that negatively affects both mental health and daily functioning [31]. On the one hand, chronic stress impairs the initiation and maintenance of sleep and reduces sleep depth; on the other, fragmented and non-restorative sleep weakens coping capacity, makes symptom management more difficult, and ultimately increases perceived stress. The concurrent associations observed between disturbed sleep, elevated stress and lower SF-36 scores—particularly in domains related to vitality, social functioning, pain and role functioning—suggest a potentially interrelated pattern among these dimensions, particularly involving energy levels, social participation, pain perception and role functioning within this cross-sectional sample. This model is in line with work showing that, among dialysis patients, symptom burden, poor sleep and impaired quality of life tend to co-occur and to mutually amplify one another [28]. Subgroup analyses revealed significant differences across macro-geographical areas, with poorer quality of life and worse sleep in some regions of the country. However, the interpretation of these findings should consider that geographical areas were grouped into two macro-categories for analytical purposes, which may have reduced the granularity of regional differences. These geographical differences may reflect regional variability in healthcare organization, access to home dialysis modalities, socioeconomic disparities, and availability of psychosocial support services within the Italian National Health System. However, as contextual variables were not directly measured, these interpretations remain speculative and should be explored in future analytical studies specifically designed to assess organizational and structural determinants. Although the cross-sectional design does not allow causal inferences and organizational variables were not directly measured, the observed geographical differences may reflect contextual variations that warrant further investigation in future analytical studies. This is a relatively unexplored area in Italian research and warrants further investigation from a health-equity perspective.
Differences by dialysis modality represent another clinically relevant aspect. These differences should be interpreted cautiously, as the non-probability sampling design does not allow adjustment for potential confounding variables. In our sample, patients on peritoneal dialysis reported better physical functioning than those on hemodialysis. This is coherent with studies showing more favorable quality-of-life profiles in peritoneal dialysis patients in some settings, possibly related to greater autonomy in treatment management and a stronger sense of control over daily routines [32].Symptom burden further reinforces this systemic view. Patients reporting fatigue, weakness, psychological symptoms or intradialytic/post-dialytic discomfort had markedly lower scores in vitality, mental healthand social functioning. This is consistent with the correlational findings, in which vitality emerged as a shared domain associated with both poorer sleep quality and higher perceived stress [28,29]. These findings, in line with previous work documenting the strong association between symptom distress, sleep disturbance and quality of life, support the view that symptom management is not only a biomedical objective but also a key psychosocial leverage point [28]. Taken together, our findings suggest that quality of life in dialysis patients should be conceptualised as the outcome of a dynamic system in which physical symptoms, sleep disturbance, perceived stress and contextual factors interact with each other. Within the limits of a cross-sectional design, these findings support the potential value of multidisciplinary approaches aimed at addressing sleep, stress, and symptom burden in dialysis populations. These findings are particularly relevant for nursing practice because nurses are ideally positioned to detect early changes in symptom burden, sleep quality, perceived stress, and quality of life during routine dialysis care. This perspective reinforces the role of nursing assessment as a key step in identifying unmet needs and tailoring supportive interventions. For nursing practice, at least three priority areas emerge:
- Routine screening:
1.1) systematic assessment of sleep quality (PSQI), perceived stress (PSS-10) and health-related quality of life (SF-36) as part of regular follow-up;
1.2) early identification of high-risk profiles combining poor sleep, high stress and markedly impaired quality of life.
2) Targeted interventions on sleep and stress:
2.1) tailored sleep-hygiene education that explicitly considers dialysis-related constraints (session schedules, intradialytic symptoms, daytime napping);
2.2) structured psychological and stress-management interventions (nurse-led counselling, peer groups, mindfulness-based programmes), which have shown promising effects on stress, sleep and quality of life in this population [3,33].
3) Personalisation of care pathways:
3.1) considering geographic area, dialysis modality and symptom profile when stratifying risk and designing educational and supportive pathways;
3.2) when clinically appropriate, promoting treatment options that enhance autonomy and perceived control.
In summary, the interplay between sleep, stress and quality of life observed in this study invites us to move beyond a fragmented view of care. Relatively focused interventions on sleep and coping may generate cascading benefits across the psycho-physical equilibrium of dialysis patients, potentially improving not only patient-reported outcomes but also long-term adherence and clinical trajectories.
From a nursing perspective, these findings are coherent with the rationale outlined in the Introduction, where health-related quality of life, sleep quality, and perceived stress were identified as key dimensions of holistic care in patients undergoing dialysis. The strong interrelationship observed among these variables highlights the importance of systematic assessment in routine nursing practice. Nurses play a central role in identifying sleep disturbances and psychological distress, providing patient education, and implementing supportive interventions aimed at improving coping strategies and overall well-being [14,34].
Study limitations
The decision to conduct a cross-sectional study prevents analysis and evaluation of the course of the previously listed disorders. A further limitation relates to the sample size, which is not representative of the entire Italian population undergoing dialysis treatment. Moreover, pre-existing medical conditions were assessed through a single self-reported item asking participants to indicate their main known disease before the onset of chronic kidney disease. As a result, our data do not allow a detailed quantification of multimorbidity, which is known to be highly prevalent in dialysis populations, and comorbid burden may therefore be underestimated in this sample. Furthermore, the use of convenience sampling and online recruitment may have introduced selection bias, potentially favoring individuals with greater digital literacy or engagement in patient associations. In addition, given the exploratory nature of the study and the absence of a priori hypotheses, inferential analyses were performed without adjustment for multiple comparisons. Therefore, subgroup differences and associations should be interpreted with caution and considered hypothesis-generating rather than confirmatory. Another limitation of this study is the lack of information on dialysis vintage, defined as the time elapsed since the initiation of dialysis treatment, which may significantly influence patients’ physical, psychological, and adaptive responses to therapy. In addition, variables related to the availability of informal or formal caregiving support, as well as work-related aspects such as absenteeism or presenteeism, were not assessed. These factors may play an important role in shaping patients perceived burden, quality of life, and stress levels. Future studies should incorporate these variables to provide a more comprehensive understanding of the multidimensional impact of dialysis on patients’ daily lives.
CONCLUSIONS
To our knowledge, this cross-sectional observational study represents one of the first Italian nationwide attempts to jointly assess health-related quality of life, sleep quality, and perceived stress in a heterogeneous adult dialysis population. Findings indicate a moderate overall level of health-related quality of life, with marked impairment in role limitations due to physical and emotional problems and in general health perception. Nearly all participants reported clinically relevant sleep disturbance, and more than two thirds experienced at least moderate levels of perceived stress. Significant associations between poorer sleep quality, higher perceived stress, and lower SF-36 domain scores suggest an interrelated pattern in which biological, psychological, and contextual dimensions converge to shape the lived experience of dialysis, influencing both functional capacity and psychosocial well-being. Within this framework, quality of life appears as the emergent outcome of a dynamic and multidimensional system rather than a purely physical construct. Observed differences across geographical areas and dialysis modalities, although not allowing causal inference, highlight potential contextual and organizational influences within the Italian healthcare setting and warrant further investigation.Overall, these findings support the systematic integration of sleep and stress assessment into nephrology care pathways and reinforce the value of multidisciplinary models addressing symptom burden, psychosocial distress, and patient-reported outcomes. Future longitudinal studies with larger samples are needed to clarify directional relationships and to evaluate the effectiveness of targeted interventions on patient-centered outcomes and long-term care trajectories. From a nursing perspective, the systematic assessment of quality of life, sleep quality, and perceived stress should be considered an integral part of routine dialysis care. These dimensions provide essential information to guide personalized nursing interventions, strengthen patient-centered care, and support improved clinical outcomes.
List of abbreviations
CKD – Chronic Kidney Disease;
QoL – Quality of Life
SF-36 – Short Form-36 Health Survey
IQOLA – International Quality of Life Assessment Project
PSQI – Pittsburgh Sleep Quality Index
PSS-10 – Perceived Stress Scale – 10-item version
PF – Physical Functioning
RP – Role Physical
RE – Role Emotional
VT – Vitality
MH – Mental Health
SF – Social Functioning
BP – Bodily Pain
GH – General Health
PCS – Physical Component Summary
MCS – Mental Component Summary
SD – Standard Deviation
ANOVA – Analysis of Variance
χ² – Chi-square test
r – Pearson correlation coefficient
Funding
The authors declare that no funds, grants, or other support were received during the preparation of this manuscript.
Competing Interests
The authors have no relevant financial or non-financial interests to disclose.
Ethics Approval
This study was conducted in accordance with the principles of the Declaration of Helsinki. Ethical approval was obtained from the Ethics Committee of IRCCS Istituto Oncologico “Gabriella Serio”, Bari, Italy (Protocol No. 568, data approval: July 30, 2024).
Consent to participate
Informed consent was obtained from all individual participants included in the study.
Data Availability
The datasets generated during and analyzed during the current study are available from the corresponding author on reasonable request.
Author Contributions
Ivan Rubbi and Roberto Lupo contributed to the study conceptualization and methodology, data collection, analysis and interpretation of results, and drafting of the first version of the manuscript. Luana Conte and Elsa Vitale made substantial contributions to conceptualization, methodology, scientific supervision, and critical revision of the manuscript. Ritiana Marinelli, Stefano Botti, Carmela Triglia, and Antonino Calabrò contributed to data collection and manuscript revision. Federico Cucci contributed to manuscript review and editing. All authors read and approved the final version of the manuscript. Ivan Rubbi and Roberto Lupo contributed equally as first authors. Luana Conte and Elsa Vitale contributed equally as senior authors.
REFERENCES
- Pretto CR, Winkelmann ER, Hildebrandt LM, Barbosa DA, Colet C de F, Stumm EMF. Quality of life of chronic kidney patients on hemodialysis and related factors. Rev Lat Am Enfermagem 2020;28. https://doi.org/10.1590/1518-8345.3641.3327.
- Italian Ministry of Health. Malattie renali croniche [Internet]. 2024 [cited 2026 Apr 11]. Available from: https://www.salute.gov.it/portale/salute/p1_5.jsp?area=Malattie_renali
- Alshammari B, Alkubati SA, Pasay-an E, Alrasheeday A, Alshammari HB, Asiri SM, et al. Sleep Quality and Its Affecting Factors among Hemodialysis Patients: A Multicenter Cross-Sectional Study. Healthcare 2023;11:2536. https://doi.org/10.3390/healthcare11182536.
- Schouten RW, Nadort E, Harmse V, Honig A, van Ballegooijen W, Broekman BFP, et al. Symptom dimensions of anxiety and their association with mortality, hospitalization and quality of life in dialysis patients. J Psychosom Res 2020;133:109995. https://doi.org/10.1016/j.jpsychores.2020.109995.
- Rahman S, Pradido R. The anxiety symptoms among chronic kidney disease patients who undergo hemodialysis therapy. International Journal of Public Health Science (IJPHS) 2020;9:281. https://doi.org/10.11591/ijphs.v9i4.20450.
- Davydov GG, Nashat H, Ghali S, Afifi S, Suryadevara V, Habab Y, et al. Common Sleep Disorders in Patients With Chronic Kidney Disease: A Systematic Review on What They Are and How We Should Treat Them. Cureus 2023;15:e44009. https://doi.org/10.7759/cureus.44009.
- Cheng E, Evangelidis N, Guha C, Hanson CS, Unruh M, Wilkie M, et al. Patient experiences of sleep in dialysis: systematic review of qualitative studies. Sleep Med 2021;80:66–76. https://doi.org/10.1016/j.sleep.2021.01.019.
- Tan L-H, Chen P-S, Chiang H-Y, King E, Yeh H-C, Hsiao Y-L, et al. Insomnia and Poor Sleep in CKD: A Systematic Review and Meta-analysis. Kidney Med 2022;4:100458. https://doi.org/10.1016/j.xkme.2022.100458.
- Bossola M, Angioletti L, Di Giovanni M, Mariani I, Di Stasio E, Balconi M. Perceived Stress Is Linked to Depression but Not to Clinical Outcomes in Maintenance Hemodialysis Patients. J Clin Med 2025;14:883. https://doi.org/10.3390/jcm14030883.
- Kim D-S, Kim S-W, Gil H-W. Emotional and cognitive changes in chronic kidney disease. Korean J Intern Med 2022;37:489–501. https://doi.org/10.3904/kjim.2021.492.
- Muflih S, Alzoubi KH, Al-Azzam S, Al-Husein B. Depression symptoms and quality of life in patients receiving renal replacement therapy in Jordan: A cross-sectional study. Annals of Medicine & Surgery 2021; 66:102384. https://doi.org/10.1016/j.amsu.2021.102384.
- Doan V, Shoker A, Abdelrasoul A. Quality of Life of Dialysis Patients: Exploring the Influence of Membrane Hemocompatibility and Dialysis Practices on Psychosocial and Physical Symptoms. Journal of Composites Science 2024;8:172. https://doi.org/10.3390/jcs8050172.
- Meo Stefania. Mutualità e qualità di vita nelle nefropatie: studio osservazionale longitudinale. IJN 2025;3:44–53.
- Wilkinson A, Whitehead L. Evolution of the concept of self-care and implications for nurses: A literature review. Int J Nurs Stud 2009;46:1143–7. https://doi.org/10.1016/j.ijnurstu.2008.12.011.
- Apolone G, Mosconi P, Ware JE Jr. Questionario sullo stato di salute SF-36: manuale d’uso e guida all’interpretazione dei risultati. Milano: Guerini e Associati; 1997.
- Ware JE, Sherbourne CD. The MOS 36-item short-form health survey (SF-36). I. Conceptual framework and item selection. Med Care 1992;30:473–83.
- Buysse DJ, Reynolds CF, Monk TH, Berman SR, Kupfer DJ. The Pittsburgh sleep quality index: A new instrument for psychiatric practice and research. Psychiatry Res 1989;28:193–213. https://doi.org/10.1016/0165-1781(89)90047-4.
- Cohen S, Kamarck T, Mermelstein R. A global measure of perceived stress. J Health Soc Behav 1983;24:385–96.
- Guerra F, Di Giacomo D, Ranieri J, Tunno M, Piscitani L, Ferri C. Chronic Kidney Disease, and Its Relationship with Mental Health: Allostatic Load Perspective for Integrated Care. J Pers Med 2021;11:1367. https://doi.org/10.3390/jpm11121367.
- Sanjay Kalra, Sourabh Sharma, Manisha Sahay. Dialysis Distress. J Pak Med Assoc 2024;74:1000–2. https://doi.org/10.47391/JPMA.24-37.
- Iliescu EA. Quality of sleep and health-related quality of life in haemodialysis patients. Nephrology Dialysis Transplantation 2003;18:126–32. https://doi.org/10.1093/ndt/18.1.126.
- D’Onofrio G, Simeoni M, Rizza P, Caroleo M, Capria M, Mazzitello G, et al. Quality of life, clinical outcome, personality and coping in chronic hemodialysis patients. Ren Fail 2017;39:45–53. https://doi.org/10.1080/0886022X.2016.1244077.
- Tel H. Determining Quality of Life and Sleep in Hemodialysis Patients. Dial Transplant 2009;38:210–5. https://doi.org/10.1002/dat.20296.
- Parvan K, Lakdizaji S, Roshangar F, Mostofi M. Quality of sleep and its relationship to quality of life in hemodialysis patients. J Caring Sci 2013;2:295–304. https://doi.org/10.5681/jcs.2013.035.
- Edalat-Nejad M, Qlich-Khani M. Quality of life and sleep in hemodialysis patients. Saudi Journal of Kidney Diseases and Transplantation 2013;24:514. https://doi.org/10.4103/1319-2442.111031.
- Brekke FB, Amro A, Østhus TBH, Dammen T, Waldum B, Os I. Sleep complaints, depression, and quality of life in Norwegian dialysis patients. Clin Nephrol 2013;80:88–97. https://doi.org/10.5414/CN107916.
- Elder SJ, Pisoni RL, Akizawa T, Fissell R, Andreucci VE, Fukuhara S, et al. Sleep quality predicts quality of life and mortality risk in haemodialysis patients: Results from the Dialysis Outcomes and Practice Patterns Study (DOPPS). Nephrology Dialysis Transplantation 2007;23:998–1004. https://doi.org/10.1093/ndt/gfm630.
- Wang R, Tang C, Chen X, Zhu C, Feng W, Li P, et al. Poor sleep, and reduced quality of life were associated with symptom distress in patients receiving maintenance hemodialysis. Health Qual Life Outcomes 2016;14:125. https://doi.org/10.1186/s12955-016-0531-6.
- García-Martínez P, Ballester-Arnal R, Gandhi-Morar K, Castro-Calvo J, Gea-Caballero V, Juárez-Vela R, et al. Perceived Stress in Relation to Quality of Life and Resilience in Patients with Advanced Chronic Kidney Disease Undergoing Hemodialysis. Int J Environ Res Public Health 2021;18:536. https://doi.org/10.3390/ijerph18020536.
- Turkmen K, Erdur, Turgut F, Altintepe L, Tonbul HZ, Abdel-Rahman EM, et al. Sleep quality, depression, and quality of life in elderly hemodialysis patients. Int J Nephrol Renovasc Dis 2012;5:135–142. https://doi.org/10.2147/IJNRD.S36493.
- Bilgic A, Akgul A, Sezer S, Arat Z, Ozdemir FN, Haberal M. Nutritional Status and Depression, Sleep Disorder, and Quality of Life in Hemodialysis Patients. Journal of Renal Nutrition 2007;17:381–8. https://doi.org/10.1053/j.jrn.2007.08.008.
- Reynaga-Ornelas L. Impact of sleep and dialysis mode on quality of life in a Mexican population. Southwest J PulmCrit Care 2019;18:122–34. https://doi.org/10.13175/swjpcc017-19.
- Alshammari SM, Shaheen AM, Alshammari AZ, Hamdan-Mansour AM. Mindfulness Meditation Effects on Sleep, Stress, and Physiological Biomarkers in Hemodialysis Patients: A Randomized Controlled Trial. Health Psychol Res 2025;13:e81240021. https://doi.org/10.14440/hpr.0186.
- Yang J-Y, Huang J-W, Peng Y-S, Chiang S-S, Yang C-S, Yang C-C, et al. Quality of sleep and psychosocial factors for patients undergoing peritoneal dialysis. Perit Dial Int 2007;27:675–80.
This work is licensed under a Creative Commons Attribution-NonCommercial-NoDerivatives 4.0 International License.